Assessing the Impact of Visual Design on the Interpretation of Aggregated Playtesting Data ...
summary
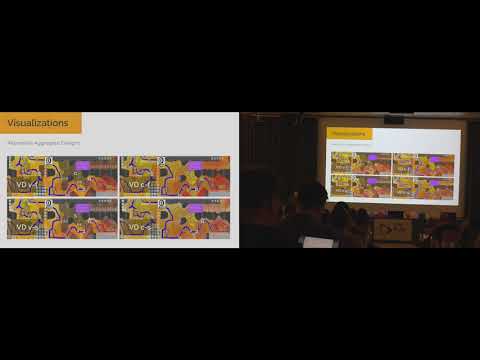
Aggregated Infinite Mario playtesting data combines player trajectories, GSR arousal (yellow→red), and clustered event icons; four visual designs vary shading (fluctuated constant color vs smooth interpolation) and transparency (constant alpha vs variable by movement). Nine professional developers evaluate readability and usefulness: variable transparency gives the best at-a-glance sense of traversal frequency and affected player counts, smooth shading blurs precise arousal locations and reduces severity readout, while constant opacity makes GSR peaks easier to spot.
AI-written summary · about
chapters (8)
- 0:00Introduction and motivation
- 1:32Visualization design and data types
- 4:02Visual design properties and alternatives
- 5:04Study methodology with developers
- 6:30Results and participant preferences
- 9:04Role-based differences in preferences
- 10:55Benefits, limitations, and conclusions
- 11:43Q&A session
related talks
 15mUsing Information Visualization to Promote Students' Reflection on "Gaming the System"
 06mUnderstanding Player Patterns by Combining Knowledge-Based Data Abstraction with Interactive ...
 42mInteractive Data Analysis: Visualization and Beyond
 08m"Trust the Process'': An Exploratory Study of Process Visualizations for Self-Reflection in Leagu...
 19mAn Eye For Design: Gaze Visualizations for Remote Collaborative Work
 06mMultivariate Visualization of Game Metrics: An Evaluation of Hexbin Maps
 20mearn to make the point: data visualisation strategy
 22mWhen Visualization Best Practices Fall On Deaf Ears