When Sampling Lies: Trustworthy Performance Profiling for Flat Workloads with Blink
Talkat 20th USENIX Symposium on Operating Systems Design and Implementation (OSDI '26) · 2026-07-13..07-15·
summary
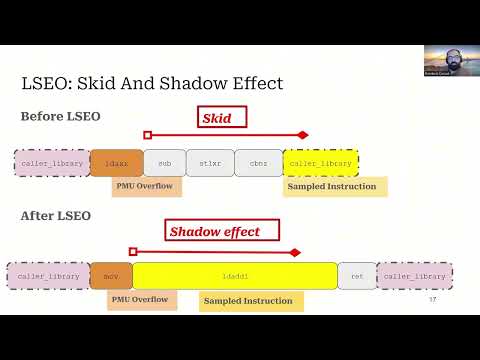
Blink instruments every function at entry and exit, reads PMU counters at those points to compute precise deltas, and uses self-patching to replace tracing logic with a single jump after a threshold, keeping overhead low. It reports 99.999% accuracy and 1% overhead, covers ~96% of functions versus perf’s 62%, and removes skid+shadow bias that produced a spurious +19M dynamic instructions (~6%) after LSEO’s long‑latency LDADL instruction. Auto‑tuning stabilizes in 2 runs versus 50 with perf.
AI-written summary · about
chapters (9)
- 0:00Research introduction
- 1:02Perf challenges on flat workloads
- 2:27LSE optimization case study
- 4:55Perf sampling skid and shadow
- 8:49Perf limitations beyond sampling
- 9:52Blink for trustworthy profiling
- 12:16Blink validates LSE results
- 13:01Blink enables auto-tuning
- 13:42Related work and conclusion
related talks
 26mProfiling Mastery: Decode Your Data and Elevate Observability
 20mLDB: An Efficient Latency Profiling Tool for Multithreaded Applications
 44mPractical guide to performance Benchmarks
 19mPROMPT: A Fast and Extensible Memory Profiling Framework
 01h 00mBuilding X-Ray for enterprise-scale software
 16mFrom Beginner to Expert in Web Performance
 16mCoding Session: Stunning Performance
 30mProfiling CPU and Memory on Linux, with Opensource Graphical Tools