Implications of R Syntax in Intro Stats
summary
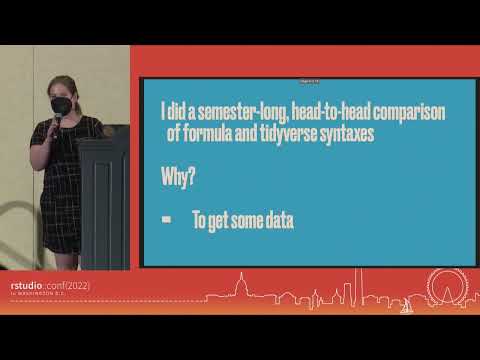
Semester-long, head-to-head comparison tests formula syntax (using formula: mosaic + ggformula + t.test) against tidyverse workflows (using tidyverse: summarize + ggplot2 + infer::t_test) for an intro stats course; both produce usable inference and plots, but formula students struggle more with missing-data handling and tidy students struggle to conceptualize two-way categorical summaries. Students see 37 vs 50 functions across sections; tidyverse students spend more RStudio Cloud time. Course materials, R Markdown examples, and an arXiv preprint are available.
AI-written summary · about
related talks
 46mElegant R: Tips from a Software Developer
 20mWorking with categorical data in R without losing your mind
 29mGrammars of Data: lessons from ~20 years of the tidyverse
 51mProgramming in the Tidyverse
 18mInteractivity and Programming in the Tidyverse
 20m15 Years of R in Quantitative Finance
 48mHuman data interactions: experiments in how humans analyze data
 54mData Analysis with R and Julia