Human data interactions: experiments in how humans analyze data
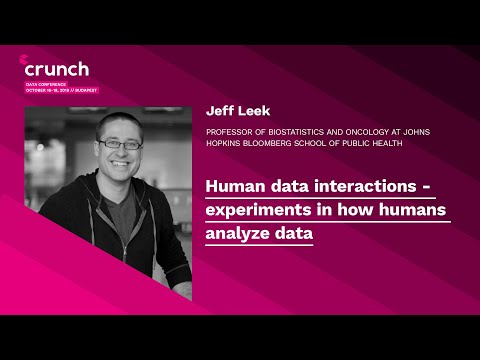
summary
Group runs experiments inside Coursera courses (over 6 million enrollments) and analyzes code from 35,000 GitHub repositories to measure how humans actually do data work. Results show 27 expert teams on one dataset produce divergent quantitative answers, ggplot2 scores marginally higher than base R in peer-graded visual quality, nudges that suggest a signal make analysts report effects more often (baseline causal calls ~16.6%), and a crowdsourced p‑hackathon reveals how simple analyst choices generate tiny p‑values.
AI-written summary · about
chapters (15)
- 0:00Start
- 0:06Human Data Interaction
- 0:37The Ai Paradox
- 2:43Ai Paradox
- 9:48Five Ways To Fix Statistics
- 23:35P-Value Hacking
- 25:17Influence Human Behavior
- 28:57Researcher Degrees of Freedom
- 30:52Data Analysis Subcultures
- 31:54P Hackathon
- 39:19Do You Have any Recommendations for Online Courses in More Advanced Data Science or Statistics
- 40:25It Will Be Easy To Publish Something That Shows Your Original Hypothesis Is Actually Wrong
- 41:23How Do You Balance Your Time between Actual Scientific Research with Your Hoppy Research of Analyzing People's Analysis
- 42:44You Have any Advice for Data Teams on How To Be More Conscious about the Social Processes Influencing Analysis or Model Development
- 46:34What Are Skills or Capabilities You Look at When Recruiting Data Scientists
related talks
 14mDesigning a Socially-Critical Data Science Course
 18mHow Data Science Can Unlock Teaching & Learning at Scale
 20mData Science Education in 2022
 19mData science education as a public health intervention in E. Baltimore
 44mAutomating Analysis
 20mThe next million R users
 16mWe R KaggleRs - At the Intersection of Data Science Communities
 48mCommon Data Science Mistakes