Digging a Pit of Success for Your Organization

summary
USAID Office of HIV/AIDS handles tens of millions of HIV monitoring records from ~30,000 sites in 50+ countries and moves from Excel to R to automate quarterly ingestion, processing and reporting. The team builds R packages like glamr for folder/secrets and glitr for branded ggplot output, wires APIs and reproducible pipelines, and runs a corps community plus a 12-part course based on R for Data Science using PEPFAR data. Result is faster, repeatable analyses and higher-quality visualizations for leadership.
AI-written summary · about
chapters (6)
- 0:00Introduction
- 3:01Why organizations need pit of success
- 5:08Infrastructure with R packages
- 7:38Leadership and colleague buy-in
- 10:07Supportive R user community
- 12:36Results and next steps
related talks
 20mMaking Data Pipelines in R: A Story From A “Self-Taught” Perspective
 15mSave an ocean of time: streamline data wrangling with R
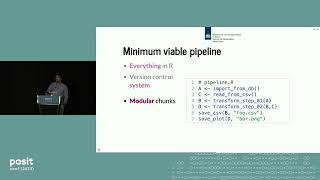 16mAutomating the Dutch National Flu Surveillance for Pandemic Preparedness
 43mData-Driven Innovation in the Federal Government.
 01h 02mMaking Data Great Again
 18mBuilding a Real-Time COVID-19 Surveillance System with R
 05mPivot
 26mData with a mission: a COVID-19 API case study