Small Team Large Organization: Building Impactful Shiny Dashboards at NIH
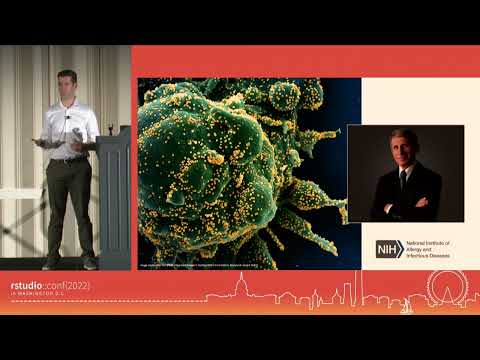
summary
Small team builds Shiny dashboards that integrate multiple databases using R Markdown + dbplyr, schedule daily refreshes on RStudio Connect daily, and persist user edits to a database so collaborators can add or remove projects with reasons. One dashboard projects funding under adjustable score cutoffs in real time; another uses supervised learning trained on 7,500 manually coded grants and tested on 3,200, where logistic regression 88.5% accuracy reduces manual coding from ~5 minutes toward 1–2 minutes.
AI-written summary · about
chapters (15)
- 0:00NIH and NIAID mission
- 1:11Science policy and R journey
- 1:53Shiny dashboards for funding
- 4:01Tracking funding challenges
- 5:28Research tracking tool
- 6:33Transparency and collaboration
- 7:41Predicting funding
- 8:47Automating processes
- 9:09NIH grant types
- 10:58Grant coding challenges
- 12:23Machine learning for grants
- 13:29AI-assisted grant coding
- 14:32User feedback and collaboration
- 15:38ML impact on productivity
- 16:01Conclusion and future goals
related talks
 18mModular, layout-as-code approach for customizable Shiny dashboards
 32mPromoting a data driven culture in a world of microservices
 28msimplifies building complex dashboards
 31mService cockpit - developer friendly Grafana based monitoring aggregator
 29mBuilding customer-visible data science dashboards with Altair / Vega / Vue
 26mBeyond the Hype: Facing Micro Frontend Challenges in Large Scale
 18mBeyond the Hype: Facing Micro Frontend Challenges in Large-Scale
 22mVisualising Enterprise Data with Angular & d3