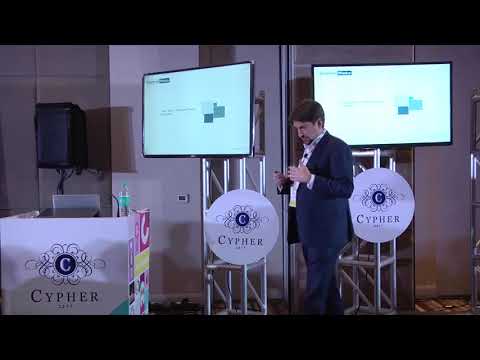
Andrew Macintosh: Executive Director at Control Risks at Cypher 2017
summary
A description of concrete outcomes: analytics pipeline uses Excel → SQL → Tableau plus text and social network analysis to find vendor and payroll fraud, not just theory. Casework uncovers 3 million USD defrauded over 20 years via fake vendors tied to one employee, ghost employees and shared bank accounts, and organized insurance fraud exposed by clustering phone numbers and maps. Statistical checks such as Benford's law and rule‑based red flags narrow hundreds of thousands of transactions to a few investigatory leads.
AI-written summary · about
chapters (13)
- 0:00Introduction
- 1:52What is data analytics
- 2:30The data
- 3:20Data analytics
- 4:36Types of analytics
- 6:00Data visualization
- 8:09Data visualization examples
- 10:53Red flag analysis
- 14:37Funeral parlor fraud
- 17:35Shared bank accounts
- 18:53Benfords law
- 21:25Marriage of data
- 25:35Tools used
related talks
 22mTechnical Tracks
 22mKeynote - In the focus of supervisory authorities- Cybersecurity & Compliance
 15mFrom Risk to Return: Measuring Cybersecurity ROI with Data Analytics
 55mKeynote - The Future of Cybersecurity Needs You, Here is Why.
 02h 11mCISO Track Panel
 40mFighting Financial Crimes as an SRE
 53mKeynote
 31mHear no Evil, See no Evil, Code no Evil ();