Implications of R Syntax in Intro Stats
summary
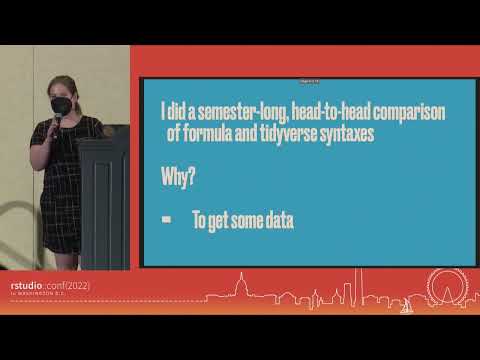
Semester-long, head-to-head comparison measures concrete differences: the formula section uses mosaic + ggformula + base t.test while the tidyverse section uses tidyverse summarize + ggplot2 + infer::t_test, exposing students to 37 functions vs 50 functions. Inference and R Markdown work well in both; formula syntax makes missing-data handling awkward, tidy data makes interpreting two-way categorical relationships and chi-square style tests harder, and tidyverse students spend noticeably more time computing on RStudio Cloud.
AI-written summary · about
related talks
 16mEXCELsioR!
 12mFrom summarizing projects to setting tags, uses of parsing R files
 24mLet's play together: Collaborative Data Science
 04mThe Expanse - Navigating the R Package Universe
 27mShiny: A GUI for the Tidyverse
 18mHow non-programmers can make sparks fly when using testthat during package development
 11mField Guide to Writing Your First R Package
 51m10 Years of Data Science Tools...and What Happens Next