A Hands-On Introduction to Your First Data Science Project
summary
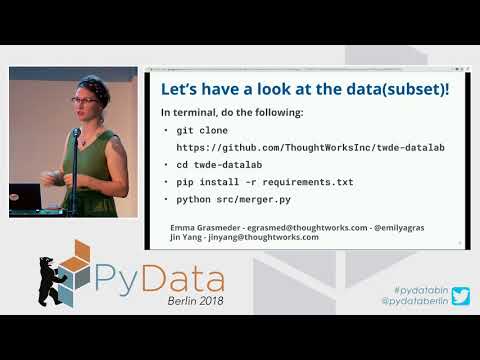
A hands-on playground for demand forecasting: a runnable GitHub repo and Jupyter notebooks that use real Ecuador supermarket data (about 4,000 items, 50 stores, ~125 million transactions) to predict item sales two weeks ahead. The pipeline uses pandas and scikit‑learn, with merger.py denormalizes to big_table then split/feature engineering (weekday, moving averages, CPI), simple baselines and a weighted error metric. Missing unit sales defaulted to zero in the baseline and reportedly beats mean imputation; everything runs locally for experimentation.
AI-written summary · about
chapters (7)
- 0:00Welcome
- 1:50First data science project
- 12:07Setting up environment
- 25:30Exploring sales data
- 44:51Feature engineering for forecasting
- 1:02:29Baseline predictions
- 1:19:32Q&A
related talks
 39mProductionising Data Science at Scale
 28mUse case in demand forecasting
 59mPredictability Check: Demand Forecasting
 23mMachine Learning with a Deep Dive into Automated Forecasting System
 01h 26mApplying Statistical Modeling & Machine Learning to Perform Time-Series Forecasting
 28mDemand Forecasting: Accuracy, Stability, Automation
 44mMethods and Tools for Time Series Data Science Problems
 31mAn incomplete list of implementing data science effectively