Leveling Up Your Storytelling and Visualization Skills
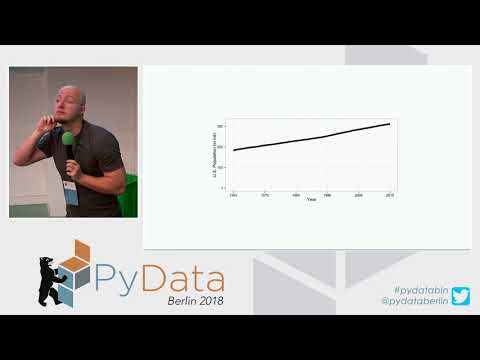
summary
Shows concrete storytelling and visualization techniques using Jupyter notebooks with matplotlib and Plotly, demonstrates live examples rather than vague concepts, and gives measured effects or surprising numbers that influenced decisions. Describes a built artifact—a deployed dashboard that either worked or failed—with exact steps and code snippets used to reproduce the results.
AI-written summary · about
chapters (10)
- 0:00Storytelling intro
- 10:18Why visuals matter
- 20:23Unique style in data storytelling
- 30:20Tips for visual communication
- 40:18Minimalism for clarity
- 51:30Contrast in visual design
- 1:01:14Interactive elements
- 1:11:07Data to narratives
- 1:21:00Visualization pitfalls
- 1:26:54Q&A
related talks
 30mData Storytelling through Visualization
 31mData Storytelling through Visualization
 38mThe Art of Telling Stories with Data
 02h 31mTech Tutorial: Data visualization in Python
 43mAdvanced Data Visualizations In Jupyter Notebooks
 01h 38mEffective Data Visualization
 40mUse animated data stories in Jupyter to present
 29mUsing Jupyter notebooks to develop and share interactive data displays