QGIS for Exploratory Data Analysis and Visualisation
summary
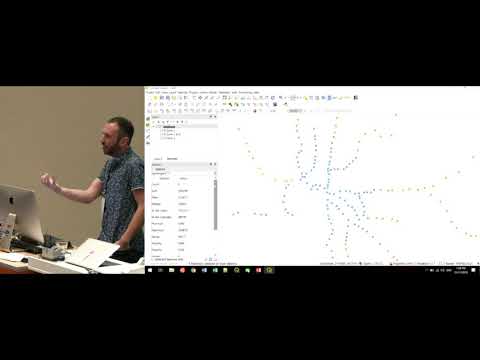
Demonstration uses a Melbourne train-station dataset (passengers per day mean ≈3,500, min ~199, max ~30,000) to show QGIS tools for reproducible EDA: the stats panel for quick summaries and expressions, the processing graphical models to save workflows and outputs so analyses are traceable, and data-defined symbology (size from passenger counts, color from education %) to build a bivariate map; notes QGIS 3.4.1 Windows instability and 3.4.2 bugfix.
AI-written summary · about
chapters (30)
- 0:00Introduction
- 0:36Strengths
- 3:06Contributors
- 3:23Live Demos
- 4:20Train Station Network
- 5:20QGIS Community
- 5:47Stats Doc
- 6:35Stats for Selected Features
- 7:28Dont do this
- 8:21Accountability
- 8:45Processing
- 9:18Tools
- 9:29GIS Operations
- 9:43Outofthebox Techniques
- 10:52Grasses
- 11:22Stats toolbox
- 12:00Stats by categories
- 12:33Save output
- 12:52Dont do that
- 13:09Use a graphical model
- 13:27Calculate station stats
- 13:56Graphical model
- 14:07Dispersions
- 14:55Maps
- 15:27Style
- 16:35Symbol Size
- 17:17Bearing Sizes
- 17:39Scaling
- 18:10Bivariate Mapping
- 18:48Invariant Map
related talks
 22mMessy maps to make sense of a complex world
 20mOpen-source Python tools to visualize and analyse ... with Samweli Mwakisambwe
 01h 01mVisualizing and Analyzing Data in 3D
 47mData Wrangling: Getting Started Working with Data for Visualizations
 31mUnpacking the geospatial engineering toolbox – an overview of data science techniques for spatial da
 20mBuilding a Data Collection App with QGIS
 01h 38mEffective Data Visualization
 57mVisualization Tools for Data Discovery