Defeating the Transparency Feature of DBI

summary
Shows concrete detectors and exploit code that distinguish native, DBI and VM runs by triggering real failures and measurable artifacts. Demonstrates a stack pivot crash under DynamoRIO (unhandled exception) and reports it to Google, lists reproducible artifacts like parent-process values, first file handle 0x27, inflated open‑FD and memory usage, and altered signal masks. Presents crafted x86 sequences that force divergent control‑flow in code caches and introduces position-independent NOPs to evade or fingerprint decoders, with proof‑of‑concept code that works against DynamoRIO and PIN.
AI-written summary · about
chapters (26)
- 0:00Introduction
- 0:33About Colin Lee
- 0:56Binary Instrumentation
- 2:27Observing Program Behavior
- 3:39Code Cache
- 5:14Dynamic Binary Instrumentation
- 6:01Popular Tools
- 6:25Transparency
- 10:12Fuzzing
- 10:25Run twice
- 11:50Simple implementation artifacts
- 12:06Checking the parent process
- 12:55More clues
- 13:35Another artifact
- 14:05Summary
- 14:20Quick Example
- 14:53Fancy Examples
- 15:24Simple Example
- 17:23New Example
- 17:37Initial Idea
- 18:50What can we do
- 20:27Developer feedback
- 21:07Robin assays
- 21:34Is it possible
- 21:55The problem
- 23:22Questions
related talks
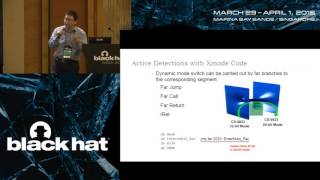 45mBreak Out of The Truman Show: Active Detection and Escape of Dynamic Binary Instrumentation
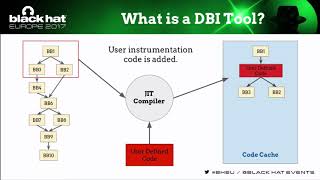 55mHiding PIN's Artifacts to Defeat Evasive Malware
 01h 06mHow hacking works
 50mD2T2 - Exposing Hidden Exploitable Behaviors Using EDF
 51mMaking the most of Security Tests
 20mBluePill: Neutralizing Anti-Analysis Behavior in Malware Dissection
 40mDynamic Binary Instrumentation Techniques to Address Native Code Obfuscation
 14mDFIR - Don't Forget Your Roots!