Through the Looking Glass: Effective Observability for Cloud-Native Applications

Talkat JCON Europe 2023 · on Tuesday, 2023-06-20· at 16:00· Cinema 9, Im Mediapark 1, 50670 Köln, Germany·
summary
Demonstrates that standardized instrumentation is practical: OpenTelemetry is used to emit traces from two Open Liberty microservices (inventory and system) and exports to Jaeger, where traces show two inventory spans and one system span. MicroProfile Telemetry (MicroProfile 6) implements tracing only and supports automatic, manual and agent modes; the demo enables the feature in server.xml, sets MicroProfile config, adds OpenTelemetry deps and uses the @WithSpan annotation to create custom spans — everything visualizes correctly in Jaeger.
AI-written summary · about
chapters (11)
- 0:00Introduction and title explanation
- 3:44Why cloud-native needs observability
- 8:00What is observability?
- 10:10Three steps to enable observability
- 13:20Logs, metrics, and traces explained
- 23:08OpenTelemetry for standardized instrumentation
- 28:03MicroProfile Telemetry overview
- 30:34Demo setup and Open Liberty introduction
- 37:10Automatic tracing with MicroProfile
- 41:42Manual tracing with annotations
- 46:14Conclusion and resources
related talks
 58mThrough the looking glass: Effective observability for cloud native applications
 47mUsing metric and traces to diagnose our cloud-native applications
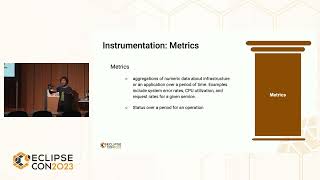 37mThrough the looking glass: Effective observability for cloud native applications
 50mBecoming a cloud-native physician: Using metric and traces to diagnose applications
 38mBecoming a cloud-native doctor
 55mCloud-Native Observability with OpenTelemetry
 27mEnd-to-end visibility in the cloud w/OpenTelemetry
 22mOpenTelemetry – An Observability Framework for Cloud-Native Software