A Guide to Observability for Your (Java) Apps in K8s

Talkat JCON Europe 2023 · on Tuesday, 2023-06-20· at 17:00· Cinema 9, Im Mediapark 1, 50670 Köln, Germany·
summary
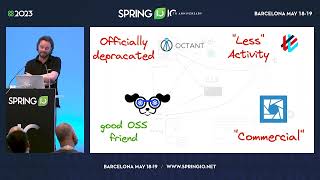
Walks through three concrete levels: API/CLI inspection with K9s, Octant, Headlamp and live recon using kubectl debug to attach a tool container into distroless pods; network-level visibility with sidecar service meshes (Istio/Kiali) but with per-pod CPU/memory overhead and one forced pod restart versus node-based eBPF meshes like Cilium/Hubble that cut proxy hops; and application tracing via OpenTelemetry Java agent (inject in Dockerfile or instrument code), exporting to Jaeger/Grafana for span-level root cause analysis.
AI-written summary · about
chapters (8)
- 0:00Introduction and context
- 10:29Basic Kubernetes observability
- 15:49Debugging with kubectl debug
- 19:38Service mesh observability
- 25:40eBPF-based service meshes
- 31:52OpenTelemetry deep dive
- 40:16Open APM tool overview
- 42:00Summary and Q&A
related talks
 45mFrom k9s to OpenTelemetry: A guide to observability for your apps in K8s
 46mA hitchhikers guide to observe (Java) applications in Kubernetes
 48mFrom k9s to OpenTelemetry:A guide to observability for your Spring apps in K8s
 40mA hitchhikers guide to observe (Java) applications in Kubernetes
 01h 29mTutorial: A Hitchhiker's Guide to CNCF/OSS Observability So...
 36mWhat's going on in my cluster?
 32mUnderstanding Observability in Kubernetes
 11mKubernetes Observability