The Inspection Paradox is Everywhere
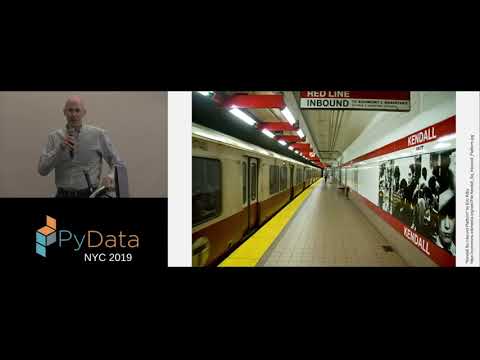
summary
Explains the inspection paradox with concrete data and code: a live Colab notebook and one-question survey, class-size data from Purdue, MBTA train intervals, Bureau of Prisons sentences, and Stanford friendship counts. Shows how numpy weighted resampling and KDE transform an unbiased distribution into the observed one, how a US family-sample mean becomes about 2.33 in a convenience sample, and how friend sampling makes the mean jump (about 42 → 100). Demonstrates inverse weighting to recover truth and that the notebook and experiments actually run.
AI-written summary · about
chapters (14)
- 0:00Introduction
- 1:03Mother’s children bias
- 4:12Length biased sampling
- 5:41Class sizes bias
- 9:32Unbiased distributions from biased samples
- 11:02Airline passengers paradox
- 12:25Waiting times and buses
- 14:11Friendship paradox
- 17:23Running speeds in relays
- 20:36Highway speed observations
- 20:57Prison sentences bias
- 23:51Inspection over time
- 26:38Summary
- 28:51Q&A
related talks
 29mIt might look normal but this distribution will ruin your stats
 08mIt might look normal but this distribution will ruin your stats
 25mVerifying and evaluating scientific results with the open source package "scores"
 52mMaking Better Decisions with Data
 22mWhen statistics become stories
 31mUsing Simpson’s Paradox to Discover Interesting Patterns in...
 32mYou've got trust issues, we've got solutions: Differential Privacy
 40mHow to Lie With Stats and Charts