It might look normal but this distribution will ruin your stats

summary
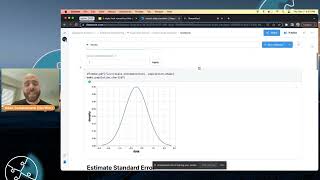
Claim: a deceptively bell-shaped contaminated normal appears normal yet breaks standard tests and produces many false negatives. A simulation shows two groups with the same effect give 90% vs 20% detection using classic t-tests versus contaminated samples. Uses practical Python tools — the hypothesize library, percentile bootstrap and trimmed-mean estimators — plus an interactive Deepnote notebook that reproduces the code, parameters, and sampling experiments so results can be inspected.
AI-written summary · about
chapters (12)
- 0:00Introduction
- 1:05Roadmap
- 3:30The distributions we find in nature
- 9:03Power power
- 13:33Live demo
- 15:19Winterized Correlation
- 16:29Sexual Attitude
- 18:14The Good Stuff
- 21:29Patterns of effects
- 22:18Notebook
- 24:31Build your own distribution
- 26:57Conclusion
related talks
 08mIt might look normal but this distribution will ruin your stats
 01h 15mAB-testing by cluster
 32mThe Inspection Paradox is Everywhere
 01h 22mDoing frequentist statistics with Scipy
 40mHow to Lie With Stats and Charts
 11mEverything That You Wanted To Know About P-Values But Were Afraid To Ask
 52mMaking Better Decisions with Data
 30mExtremes, outliers, and GOATS: on life in a lognormal world