Hacking the Data Science Challenge
summary
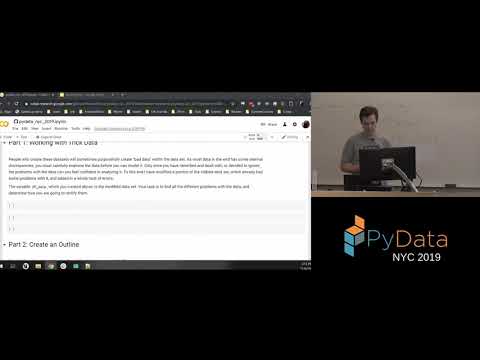
Claims a repeatable, time-boxed recipe for finishing a data‑science take‑home by automating the dull bits and delivering a story, not just plots. Shows a Colab notebook with pandas profiling and Altair examples, a simple modeling path (linear / tree baselines, avoid neural nets here), concrete pitfalls found in Citi Bike (negative durations, same bike in two places, a huge 1969 birth‑year spike), and produces reproducible predictions plus a results summary and next steps.
AI-written summary · about
chapters (11)
- 0:00Data science challenge intro
- 1:25Problems with challenges
- 3:10Trip data issues
- 19:21Data issues discussion
- 27:26Challenge outline
- 45:11EDA and modeling
- 59:50Pandas profiling
- 1:13:59EDA plots
- 1:19:47Results presentation
- 1:20:30Submission structure
- 1:24:41Portfolio tips
related talks
 01h 14mUp your Bus Number - A Reproducible Data Science Workflow
 42mSimplifying Data Analysis with GitHub Codespaces, Jupyter Notebooks & Open AI
 28mThe Coding Portion of Data Science
 41mBetter Code for Data Science
 42mHow to be a 10x Data Scientist
 20mSkrub DataOps, Probabl
 42mI'm Starting in DataScience – Where to Begin?
 30mBe kind to yourself! Spend (less) time on Data Exploration