The Art of Prototyping Analytics
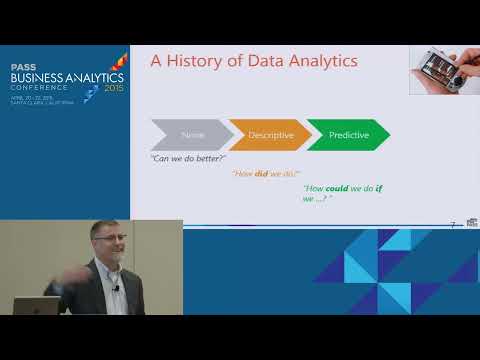
summary
Shows how to prototype end-to-end analytics with Excel tools: extract and clean HTML/web tables with Power Query, model with Power Pivot, publish to Power BI and automate refresh with Power Update. Demonstrates shaping oddly formatted files into dates, handling a 300 million‑row source that ends up compressed to 2.2 MB, and delivering interactive Power View dashboards that support daily refresh and user-driven dashboards. Presents a short ROI spreadsheet, a small cross‑functional team model, and an iterative delivery loop that succeeds in practice.
AI-written summary · about
chapters (7)
- 0:00Introduction
- 10:16Data culture in orgs
- 24:24Dysfunctional to functional analytics
- 34:55Prototyping in Excel
- 53:29Visual analytics with Power BI
- 1:00:42Automating with Power Update
- 1:03:13Empowering leaders
related talks
 18mEmpowering Business Through Data
 58mProductivity Revolution in Excel
 49mVisualizing Data: the Good, the Bad, and the Ugly
 50mThe Path to Success with Power BI: Best Practices
 50mBuilding an Empire - Implementing Power BI Step by Step
 47mFrom Power BI to Excel - The best of two worlds
 59mSelf-Service Data Modeling
 48mCombine Power BI with External Tools