Gaining Observability Into Your CI/CD Pipeline
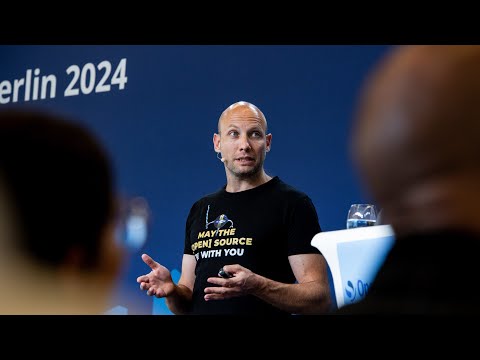
summary
Engineered CI/CD observability by instrumenting Jenkins to export env-vars, adding a summary step that emits JSON, indexing runs in OpenSearch, and building dashboards, Slack reports and Lucene-driven alerts; metrics live in Prometheus/Grafana and traces via OpenTelemetry/Jaeger for per-run bottleneck analysis. The pipeline shows step durations, flaky-test counts, failing machines and spike thresholds so teams kill bad agents or triage code. Results: collect store visualize report with OpenSearch + OpenTelemetry yields a significant reduction in lead time for changes and much less on‑call toil.
AI-written summary · about
chapters (15)
- 0:00CI/CD observability challenges
- 3:16Speaker background and context
- 5:03Defining KPIs with Dora metrics
- 7:13Why Jenkins alone wasn’t enough
- 9:01Four steps to observability
- 9:23Collecting pipeline data with OpenSearch
- 10:26Storing pipeline data
- 12:12Dashboard design from questions
- 15:23Automated reports and alerts
- 17:11Test performance observability
- 18:59Team-specific visualizations
- 20:04Distributed tracing drill-down
- 21:55Metrics across CI/CD layers
- 23:17Key outcomes and benefits
- 24:41Q&A
related talks
 44mHow We Gained Observability Into Our CI CD Pipeline
 43mHow We Gained Observability Into Our CI/CD Pipeline
 26mHow We Gained Observability Into Our CI/CD Pipeline
 55mHow We Gained Observability Into Our CI/CD Pipeline
 28mEnd-to-end CI/CD observability with open source
 30mMaking your CI/CD Pipelines Speaking in Tongues with Open...
 35mUsing the DevOps Pipeline to Generate Continuous, Valuable Insights
 27mHow We Streamlined Our SDLC with Observability - from GitHUB via Jenkins, Harbor, Argo to K8S