How We Gained Observability Into Our CI/CD Pipeline

summary
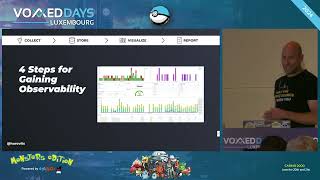
Engineers instrument Jenkins to export branch, commit, machine and step data into environment variables, write a JSON summary at job end, and persist it to Elasticsearch/OpenSearch for history and aggregation. Dashboards in Kibana/OpenSearch visualize failures, flaky tests, step durations and problematic machines; alerts and morning Slack reports automate DoD checks. For traces the pipeline emits spans via OpenTelemetry + Jaeger, and system metrics use Prometheus + Grafana; result is dramatically shortened lead time for changes and far fewer painful DoD shifts.
AI-written summary · about
chapters (4)
- 0:00Start
- 13:50What's Next: Troubleshoot Pipeline Performance with Distributed Tracing
- 20:54Store Metrics in Prometheus
- 21:47Visualize with Grafana dashboards
related talks
 43mHow We Gained Observability Into Our CI/CD Pipeline
 35mGaining Observability Into Your CI/CD Pipeline
 55mHow We Gained Observability Into Our CI/CD Pipeline
 44mHow We Gained Observability Into Our CI CD Pipeline
 28mEnd-to-end CI/CD observability with open source
 27mHow We Streamlined Our SDLC with Observability - from GitHUB via Jenkins, Harbor, Argo to K8S
 30mMaking your CI/CD Pipelines Speaking in Tongues with Open...
 23mDashboards for DevOps: How to Set Up the Right Reports