How We Gained Observability Into Our CI CD Pipeline

summary
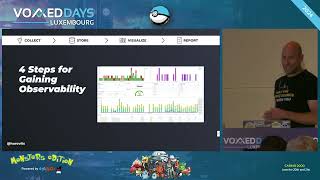
Jenkins pipelines get instrumented into environment variables and a final JSON summary, sent to OpenSearch/OpenSearch Dashboards for logs/events, traces emitted via OpenTelemetry + Jaeger and visualized as span timelines, and metrics scraped with Telegraf/Prometheus into Grafana; alerts and Slack/PagerDuty notifications link back to dashboards. The four-step pattern collect store visualize report drives aggregated dashboards, historical retention off the Jenkins host, flaky test tracking, and a measurable improvement in lead time for changes and on call experience, with a CNCF OpenTelemetry SIG standardizing CI CD semantic conventions.
AI-written summary · about
chapters (17)
- 0:00CI/CD observability challenges
- 3:15Introduction
- 5:20DOR metrics for DevOps
- 7:51Need for CI/CD visibility
- 9:19Goals for CI/CD observability
- 10:00Steps to improve observability
- 13:53Dashboards from pipeline data
- 17:27Automated reports and alerts
- 19:30Observability beyond Jenkins
- 22:59Pipeline tracing investigation
- 26:11OpenTelemetry for CI/CD
- 28:41Visualizing execution traces
- 30:29Granular tracing in Maven
- 32:13Monitoring Jenkins metrics
- 38:11CI/CD observability principles
- 40:18Results and benefits
- 41:22Standardizing with CNCF
related talks
 43mHow We Gained Observability Into Our CI/CD Pipeline
 35mGaining Observability Into Your CI/CD Pipeline
 26mHow We Gained Observability Into Our CI/CD Pipeline
 55mHow We Gained Observability Into Our CI/CD Pipeline
 28mEnd-to-end CI/CD observability with open source
 30mMaking your CI/CD Pipelines Speaking in Tongues with Open...
 27mHow We Streamlined Our SDLC with Observability - from GitHUB via Jenkins, Harbor, Argo to K8S
 06mProject Lightning Talk: Quick Intro to CI/CD Observability with OpenTelemetry