Enhance Query Execution Visibility in OS with OpenTelemetry

summary
Claims that query execution visibility in OpenSearch improves by instrumenting the search path with a lightweight Telemetry-otel plugin that wraps the OpenTelemetry SDK and exports metrics and traces (via an otel-collector or direct exporter) to OpenSearch. The build injects a tracer and metric registry into the transport/search entrypoint, emits spans with trace/span IDs and latency attributes, and supports collectors’ receivers/processors/exporters pipeline; the plugin is usable now and captures end-to-end spans and metrics for query debugging.
AI-written summary · about
chapters (12)
- 0:00Observability and OpenTelemetry
- 1:14Why observability matters
- 2:41Three pillars of observability
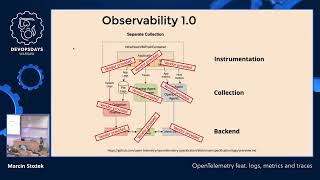
- 5:12Distributed tracing
- 9:06OpenTelemetry architecture
- 11:33Instrumenting services
- 13:42Context propagation
- 14:47OpenTelemetry with other tools
- 15:55OpenTelemetry Collector
- 16:17OpenTelemetry in OpenSearch
- 16:40Instrumentation on search path
- 17:22Key takeaways
related talks
 20mSeeing Is Believing: OpenTelemetry and OpenSearch in Next-Gen Observability
 22mFrom Telemetry to Insight: Building AI-Powered Observability Pipelines with OpenSearch
 29mOpenTelemetry With OpenSearch: Use-Cases, Status and Roadmap
 26mPlug-and-Play Observability: OTel Auto-Instrumentation for LLMs in OpenSearch
 29mMastering Search Performance: Advanced Query Insights for Production OpenSearch
 34mHow to Do Microservice Observability with OpenSearch
 32mOpenTelemetry feat. logs, metrics and traces
 38mQuery Insights Deep Dive: From Architecture to Production Optimization