Introduction to profiling python performance with USDT
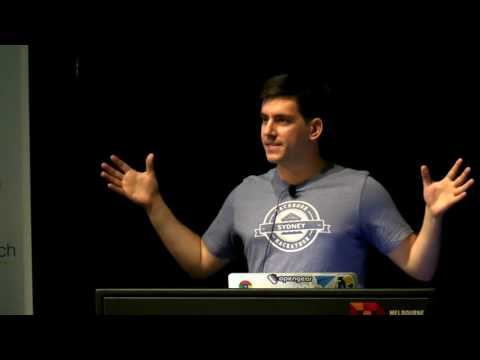
summary
Adds Python 3.6 USDT probes into CPython and demonstrates capturing garbage-collection start/stop and function entry/exit, using BCC/eBPF and systemtap (DTrace mentioned). Example instrumentation counts GC events (demo shows count = 3) by attaching to the interpreter and reading a shared BPF table; it works but requires root/kernel support, is Linux-only, can be expensive to run continuously, and may be blocked by kernel-module or PCI-compliance restrictions.
AI-written summary · about
chapters (9)
- 0:00Introduction
- 1:11Debugging fundamentals
- 5:43Understanding USDT probes
- 8:55Instrumentation in Python
- 11:55Systemtap and tooling
- 14:20eBPF and BCC framework
- 18:10Legacy of DTrace
- 19:19Practical implementation
- 24:01Q&A and conclusion
related talks
 26mChecking your cryptography usage with eBPF
 25mKernel tracing with BPF
 55mLinux Kernel Debug And Profiling Tools
 38mThe Next Linux Superpower: eBPF Primer
 31mFantastic tracepoints and where to find them
 38mLinux Kernel Tracing Using eBPF
 53mGuider: Performance Tracing Features for Linux
 27mLow-Overhead Tracing Using eBPF for Observability into Kubernetes Apps and Services