Distributed Tracing and Monitoring with OpenCensus
summary
OpenCensus provides multi-language client libraries, exporters and a collector so services send traces and metrics to different backends without redeploying. Demo shows a Zipkin exporter producing a trace with 11 spans, metrics recorded as Stackdriver metric "sample execution count" and a Hipster Shop run where tail-based sampling routes only error-containing traces to one Jaeger instance while a head-based instance receives mixed traffic, proving smart sampling cuts noise and storage cost.
AI-written summary · about
chapters (10)
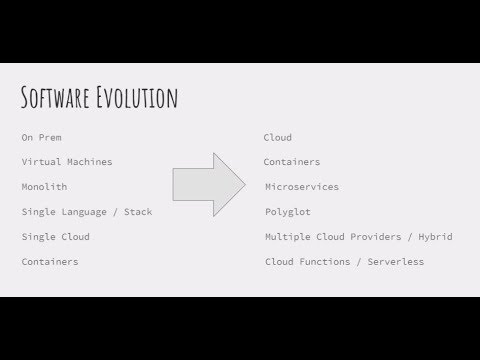
- 0:00SOFTWARE EVOLUTION
- 6:26ULTIMATE RECIPE FOR RELIABLE CLOUD SERVICE
- 10:51TRACING WITH OPENCENSUS - THE OPTIONS
- 16:56CONFIGURE SAMPLER
- 17:46USING THE TRACER
- 27:04INSTRUMENTATION WITH METRICS
- 38:48OPENCENSUS SERVICE
- 41:58TRACES & SAMPLING
- 49:45INTEGRATIONS
- 50:39COMMUNITY
related talks
 01h 02mDistributed Tracing and Monitoring with OpenCensus
 20mAchieving Observability into Your Application with OpenCensus
 16mPragmatic execution tracing
 49mDistributed Tracing: How the Pros Debug Concurrent and Distributed Systems
 36mA Survey of the OSS Tracing Ecosystem - Ben Sigelman & Ted Young, LightStep
 32mDistributed Tracing in Action: Our Journey with OpenTelemetry
 21mOpen Telemetry
 30mDistributed Tracing: From Theory to Practice