Better Data Exploration and Visualisation with Elasticsearch and Kibana

summary
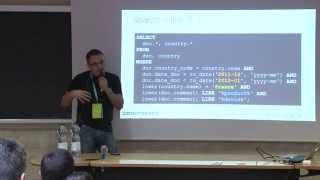
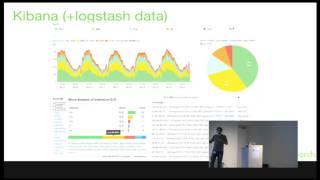
Demonstration uses Elasticsearch and Kibana for real exploration not theory: shows a term vs match query gotcha from analyzers and lowercasing, loads about 10,000 documents to run date histograms, nested aggregations, geographic heatmaps and dashboards, and uses the Python client to bulk ingest; maps and dashboards update live and embedding/kiosk options work; a commercial anomaly detector highlights a feature with a 100x signal increase; overall proves the stack can replace some notebook prototyping when scale and built‑in text/search analysis matter.
AI-written summary · about
chapters (14)
- 0:00Start
- 5:06Charting Incoming Data
- 12:43Textual Analysis
- 16:24Query Type
- 17:54Custom Analyzers
- 20:50Aggregations
- 23:12Extract Summaries
- 23:30Filter
- 24:44Time Series Visual Builder
- 26:45Sub Aggregations
- 27:29Range Aggregation
- 28:14A Coordinate Map
- 31:14Advanced Dashboards
- 36:13Python Elasticsearch Client
related talks
 42mMake Sense of your (BIG) data!
 47mMake sense of your (big) data using Elasticsearch
 48mDeeper Data Dimensions with Kibana
 37mBeyond the basics with Elasticsearch
 01h 01mData magic with the Elastic stack!
 39mHandling, extending and presenting data with ELK+
 45mProfessional Data: Using Elasticsearch's Aggregation Framework
 01h 04mDiving into Elasticsearch with .NET