Data-driven Leadership

summary
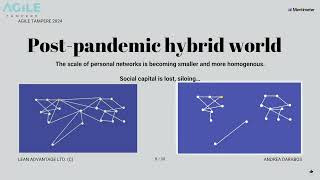
Explains how to use sociometrics to map internal relationships and information flows in teams, showing practical methods for visualizing interpersonal networks. Covers the theory behind social-network mapping and gives descriptive, data-driven examples from organizations of about 25 and 85 people to illustrate how those visualizations can inform leadership decisions.
AI-written summary · about
chapters (11)
- 0:00Introduction
- 2:13Visualization
- 4:40What is Sociometric
- 6:24We make choices
- 6:56An example
- 7:48Research
- 9:31How to turn research into practice
- 11:23How to use sociograms
- 13:48Interpersonal relationships
- 15:36How to deal with separation
- 17:01Datadriven leadership
related talks
 25mEngineering Leadership Through a Social Network Lens
 33m The Networked Collaborator
 28mShared Leadership – leaders, leaders everywhere?
 01h 07mEmbracing The Data Leadership Nexus to Achieve Strategic Success
 38mThe Five Stages of Leadership: The Journey from Coding to Leading 🧭
 04mHow to Measure Organizations, Leadership, and Personalities from a Storytelling Standpoint
 34mData, not opinions: The psychometrics of team
 28mBuilding a Data-Driven Culture: What the C-Suite Needs to Understand First