Using OpenTelemetry and Prometheus to monitor serverless
summary
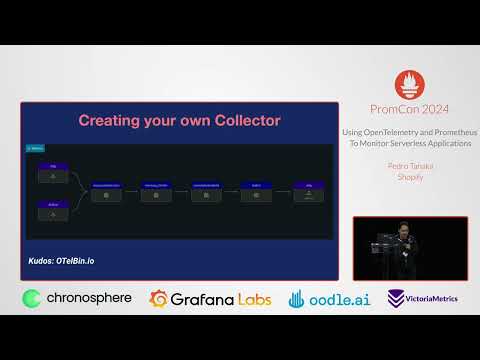
Monitors Cloud Run services with Prometheus by running an Cloud Run sidecar that hosts a trimmed OpenTelemetry Collector distribution receiving OTLP or statsd, applying a memory limiter and cumulative-to-delta conversion, then routing metrics through a custom cardinality controller with a UI. The pipeline converts statsd to Prometheus via a statd exporter, avoiding cross-region egress and UDP headaches, and notes that pritus 3.0 can accept OTLP directly so sending metrics straight to pritus is now possible.
AI-written summary · about
related talks
 21mMonitoring Serverless Workloads with OpenTelemetry and Prometheus
 24mLeveraging OpenTelemetry for Your Prometheus Pipeline
 28mOpenTelemetry developments in Prometheus over the last year
 05mOpenTelemetry in production for a year plus: the good the bad the ugly
 22mBuilding Prometheus Metrics Support in OpenTelemetry
 30mOperating Prometheus in a Serverless World
 13mConnecting Prometheus and OpenTelemetry Data for Faster Troublesho...
 23mBeyond the Ephemeral: Mastering Serverless Metrics at Scale With Shopify