Aggregating metrics in-flight: challenges and opportunities
summary
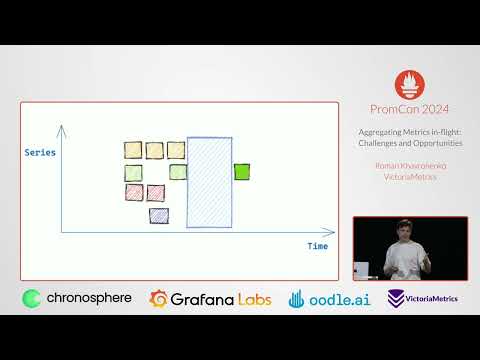
High-cardinality is reduced by performing pre-aggregation at ingest: VictoriaMetrics implements Stream Aggregation in the agent and single-node daemon to aggregate by time and labels (matchers + interval + outputs) before forwarding. Example: a 15k-series histogram is aggregated at 5m by resource/verb/bucket and yields comparable quantiles while cutting query time from ~11s to ~1.5s (~8×). Costs: roughly +1 CPU and +1 GB RAM for real-time aggregation; Prometheus used ~4× more memory in the comparison. A custom label compressor cuts worst-case memory up to ~5×; sharding and per-series state handle resets and scaling.
AI-written summary · about
chapters (18)
- 0:00Introduction and welcome
- 1:05What is high cardinality
- 3:31Limitations of recording rules
- 7:02Chain Prometheus for protection
- 8:52Stateless agent vs Prometheus
- 9:57Stream aggregation concept
- 11:23How stream aggregation works
- 13:56Stream aggregation configuration
- 15:00Reducing cardinality with stream aggregation
- 16:48Downsampling data
- 17:32Handling duplication
- 18:15Stream aggregation flexibility
- 19:19Resource cost comparison
- 20:25Memory usage challenges
- 22:33Label compression technique
- 24:17Scaling stream aggregation
- 26:25Summary and benefits
- 27:28Q&A session
related talks
 01h 00mHow do We Keep Metrics for a Long Time in VictoriaMetrics
 40mScale Your Monitoring Solution With the VictoriaMetrics Ecosystem
 30mHow We Scaled Metrics Monitoring for 10,000 Applications With Victoria...
 11mAggregating, Alerting and Graphing on Millions of Prometheus T...
 36mVictoriaMetrics: scaling to 100 million metrics per second (EN)
 11h 43mPercona Community Live Conference - Day 1 - Open Source Databases Conference
 34mSpecifics of Data Analysis in Time Series Databases
 26mThe Speed of Metrics, the Fidelity of Traces: Architecting Post-Collection Aggregation