Scale Your Monitoring Solution With the VictoriaMetrics Ecosystem

summary
VictoriaMetrics claims much lower resource use than Prometheus — published benchmarks show ~7x less disk, read/write bandwidth drops (example 50→15 MB/s) and memory 5x lower (23 GB → 4 GB) — and a single node can handle hundreds of millions of series (author cites ~100M TS or ~2M samples/sec) while the cluster splits into vminsert / vmselect / vmstorage to scale to billions. Ecosystem pieces include VM Agent stream aggregation and buffering, VictoriaLogs (lower disk/CPU than Loki) and Victoria Traces with OpenTelemetry integration.
AI-written summary · about
chapters (10)
- 0:00Introduction and background
- 10:53Discovery of VictoriaMetrics
- 17:08Demo of integrations and dashboards
- 19:13Scaling options and migration
- 22:44Monitoring the monitoring system
- 26:18Scaling logs with VictoriaLogs
- 32:23Why distributed tracing matters
- 34:54VictoriaTraces overview
- 37:51Summary and observability pillars
- 38:12Q&A session
related talks
 01h 00mHow do We Keep Metrics for a Long Time in VictoriaMetrics
 36mVictoriaMetrics: scaling to 100 million metrics per second (EN)
 28mHow to reduce expenses on monitoring with VictoriaMetrics
 30mHow We Scaled Metrics Monitoring for 10,000 Applications With Victoria...
 31mObservability: Dust Off Prometheus with VictoriaMetrics
 11h 43mPercona Community Live Conference - Day 1 - Open Source Databases Conference
 38mAggregating Metrics In-Flight: Challenges and Opportunities
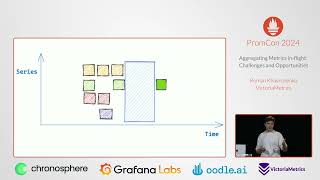 33mAggregating metrics in-flight: challenges and opportunities