Promstat, a CLI tool to analyse exporters

summary
A small CLI called promstat parses a Prometheus-style metric dump (from an exporter or an OpenTelemetry collector) and prints concrete diagnostics: counts of unique label values, most frequent key:value pairs, and the top 10 metrics by label count so you can spot high-cardinality hot spots. It reads a text matrix file, outputs stats and value listings, and helps locate cardinality explosions without spinning up Prometheus or TSDB.
AI-written summary · about
related talks
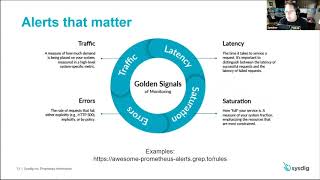 41mSo Many Metrics, So Little Time: 5 Prometheus Exporter Best Practices
 27mObservability with Prometheus and beyond
 10mPrometheus for Monitoring Metrics - Database Monitoring Tools
 31mHow to Export Prometheus Metrics from Just About Anything
 40mThe Prometheus monitoring system
 32mDemocratizing Application Monitoring with Prometheus
 33mIntro: Prometheus
 13mConnecting Prometheus and OpenTelemetry Data for Faster Troublesho...