Metrics - What's your code actually doing?

summary
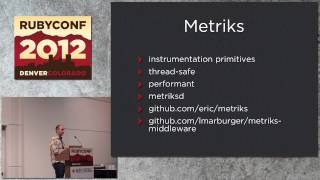
Shows concrete instrumentation: use the metrics library (gauges counters histograms meters timers), ship language clients to statsd, store and graph in graphite; send meters as per-second for graphite’s hit_count, emit a restart gauge, and examine quantiles not just means. Claims that Amazon saw revenue drop with 100 ms slower pages and Google saw a 20% drop going 400→900 ms. Demonstrates building an aggregation pipeline that serves ~160000 metrics/min on two servers and explains how to find per-step bottlenecks.
AI-written summary · about
chapters (19)
- 0:00Code instrumentation intro
- 3:46Why measure performance
- 5:33Proactive detection via metrics
- 7:21Logging pitfalls for metrics
- 8:46Metrics libraries overview
- 10:32Understanding histograms and their types
- 13:02Meters and timers
- 15:12StatsD aggregation
- 17:02Cross-host aggregation
- 18:29Graphite architecture
- 20:17Graphite naming rules
- 21:40Graphite queries & graphs
- 23:03Graphite aggregation
- 25:14Bottlenecks with timers
- 27:05Time per step calculation
- 28:32Graphite tips
- 29:54Choosing tools
- 30:38Practical applications of collected metrics
- 31:18Q&A
related talks
 18mJon Schneider at SpringOne Platform 2017
 23mYou Get What You Measure—Why Metrics Are Important
 41mRuby Monitoring State of the Union
 37mLies, Damn Lies, and Metrics
 27mEasy App Metrics
 27mGrand Treatise of Modern Instrumentation and Orchestration
 52mReal-time-first metrics
 26mGraphite@Scale or How to Store Millions of Metrics per Second