DataEngBytes 2023 - BRI-T1-05 - Larene Le Gassick

summary
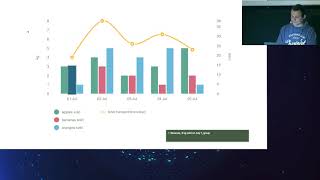
Shows that default Google Sheets charts are often unusable without tweaks and that scanned PDFs need OCR that only reaches about 90% accuracy, so human review is required. Demonstrates concrete fixes: add a plain-English summary and CSV download, move labels next to series, increase contrast with TPGi color contrast analyzer, simulate color-blind views with Color Oracle, replace reliance on color with separators or direct labels, prefer accessible libraries like Highcharts, and avoid confusing pattern fills. Includes WCAG-style checklist for keyboard and screen reader testing.
AI-written summary · about
chapters (9)
- 0:00Accessibility testing intro
- 2:25Personal accessibility story
- 7:45Why accessibility matters
- 10:12Accessibility checklist for charts
- 16:29Visual and text testing
- 21:22Color and pattern in charts
- 22:48Non-visual testing with alt text
- 24:13Interactive testing for charts
- 25:16Key takeaways and resources
related talks
 38mAccessibility in Data Visualizations: Two Case Studies
 33mInclusive Data for 1.3 Billion: Designing Accessible Visualizations
 35mAccessible Charts Done Right
 41mAccessible Charts Done Right
 25mUnlocking key metrics and patterns using Grafana
 34mAccessible Charts Done Right: Myth or Reality
 01h 10mStorytelling through data
 31mFundamentals of Data Visualization