Accessible Charts Done Right: Myth or Reality

summary
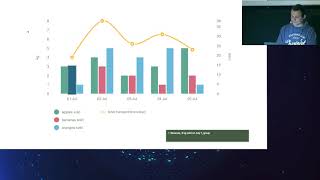
Accessible charts are possible and practical: use SVG with explicit roles and concise descriptions, add per-markup focusability via tabindex="0" and announce elements with aria-describedby, or hide a parallel data table with the visually-hidden pattern and proper scope headers so screen readers read rows reliably. Add a skip link to jump over dense charts, offer CSV/XLS downloads, and test with VoiceOver on Chrome. For heavy pages consider server-rendering charts to HTML strings to avoid shipping large D3 bundles and long load times.
AI-written summary · about
chapters (6)
related talks
 35mAccessible Charts Done Right
 41mAccessible Charts Done Right
 24mAccessible charts done right
 01h 02mDeveloping Accessible Charts
 48mAccessibility in Data Visualization
 50mAddressing the Core Issue of Data Visualization Accessibility
 38mAccessibility in Data Visualizations: Two Case Studies
 21mMusical Charts: Using OSS to Make Data Visualizations Accessible to Visually Impaired Users