Accessible Charts Done Right

summary
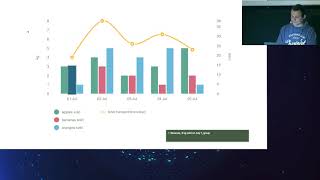
Claims that charts can be fully usable with screen readers and keyboard navigation, demonstrated using SVGs generated by D3 and tested with VoiceOver on Chrome. Implements element-level accessibility with tabindex=0 and unique labels, hides redundant axes with aria-hidden, adds a skip link and paired HTML data tables (with scope attributes) for screen-reader users. Notes rough counts: 217M low vision, 300M+ colorblind, 36M blind; flags usability breakpoints (≈20 focusable points, 250 mini-charts causing ~17s load) and offers server-side SVG rendering or downloadable CSV/PDF as fallbacks.
AI-written summary · about
chapters (13)
- 0:00Introduction
- 4:20Accessible Charts
- 6:40Chart Description
- 16:20Charts vs Accessible Data
- 17:17Combining Charts and Tables
- 24:01Flatten Tables
- 24:38Three Ways of Making Accessible Charts
- 27:50Render in the Server
- 28:58Summary
- 29:51How to make charts accessible
- 30:43Resources
- 32:11Questions
- 34:13Slate Engine
related talks
 34mAccessible Charts Done Right: Myth or Reality
 35mAccessible Charts Done Right
 24mAccessible charts done right
 01h 02mDeveloping Accessible Charts
 48mAccessibility in Data Visualization
 38mAccessibility in Data Visualizations: Two Case Studies
 21mMusical Charts: Using OSS to Make Data Visualizations Accessible to Visually Impaired Users
 50mAddressing the Core Issue of Data Visualization Accessibility