"Alert overload: How to adopt a microservices architecture..."

summary
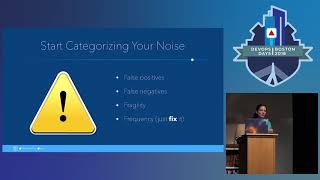
Microservices sprawl creates alert chaos: 45 services across three environments generate about 1.5 million checks/day and one developer counted ~19,000 system alerts in 50 days (~380/day) plus ~13,000 response/error alerts. Fixes: stop noisy Nagios emails, convert noisy alerts into dashboards (Graphite/Grafana, Dashing), route logs to Splunk, add request IDs and a __health JSON endpoint, use Sentry for new-error detection, run an ops cop rotation, active publish checks every minute, build a Raspberry Pi LED Silvana and run chaos tests. Inbox becomes usable.
AI-written summary · about
chapters (17)
- 0:00Introduction
- 1:37Advantages of microservices
- 2:10How many microservices do you have
- 3:04System alerts
- 3:44Functional monitoring
- 4:01Why so many alerts
- 5:30Quick Start
- 10:16Report dashboard
- 12:07Action ID
- 12:43Health checks
- 14:00Active monitoring
- 14:56Tools
- 18:54Cold sores spill
- 20:24Dashboards
- 25:36Communication
- 30:21Not getting alerts
- 34:24Summary
related talks
 16mUnderstanding Alert Fatigue
 38mEliminating Alerts or “Operation Forest”
 27mWant to Solve Over-Monitoring...
 19mSensory Friendly Monitoring: Keeping the Noise Down
 27mSensory Friendly Monitoring: Keeping the Noise Down
 27mBuilding a Scalable Monitoring System
- 16mUnderstanding Alert Fatigue
 26mSensory Friendly Monitoring- Keeping the Noise Down