Understanding World food economy with satellite
summary
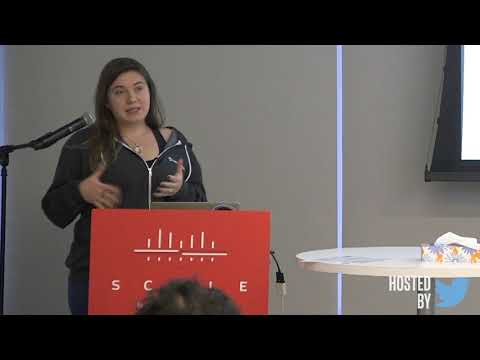
Pipeline monitors corn, soy, rice and wheat daily by combining Sentinel‑2, Landsat and Planet imagery, extracts NDVI and many indices, and trains ML (boosting) models using the USDA Cropland Data Layer as training data. Ground truth scarcity and clouds remain the major limits; radar detects irrigation and hyperspectral is required to separate poppy from cotton. Processing runs as 15-minute AWS Lambda jobs that assemble 1×1 km tiles into maps with 40,000 parallel calls and uses USDA Cropland Data Layer 85–90% accuracy for initial training.
AI-written summary · about
chapters (8)
- 0:00Introduction to satellite food mapping
- 3:37Key challenges in crop analysis
- 6:04Observation data sources explained
- 10:46Ground truth data and validation
- 12:54Data engineering and processing
- 15:46Case study poppy seed detection
- 17:42Hyper-spectral imaging benefits
- 19:42Predicting supply and demand
related talks
 04mAI and big ag data for food security
 36mClassification of Satellite Imagery
 27mThe View from Above Getting Started with Satellite Images
 10mUsing Machine Learning to Reduce World Hunger
 09mGen AI Workflows for Climate Risk Modeling in Food Systems
 22mCrop classification using NDVI
 48mTaking the planet’s pulse: AI to empower adaptation to global change
 26mMeasuring Economy with Open Earth Observations