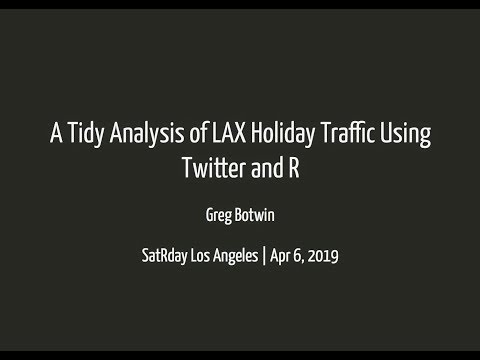
A Tidy Analysis of LAX Holiday Traffic
summary
Hourly tweets from @flyLAXairport between 2018-12-19 and 2019-01-02 are parsed with rtweet and converted to tidy format with tidyverse tools, extracting times from three approach routes to Terminal 1 plus loop times for the upper and lower levels. Natural-language parsing yields a dataset of roughly 15 days × 24 hours; peak delays cluster around 21:00, Century Boulevard routes show the longest median times, and the lower level loop consistently runs faster than the upper. Code and plots are available on the linked GitHub.
AI-written summary · about
related talks
 39mUsing a modern data stack to explore & visualize the impact of a global pandemic on airline traffic
 16mTidy Transit: Real Life Data Modeling for Public Transportation
 43mRemove before flight: Analysing flight safety data.
 18mSit back, relax, and enjoy the talk: a journey through FlightRadar24 with Python
 01h 02mLightning Talks
 01h 02mReal-time Twitter analysis with Reactive Extensions
 10mWhy So Loud! Geeking Out On Airline Data, Physics And Mapping
 25mCase Study in Travel Business - Time Series Analysis with Seasonal Data