Senses Working Overtime
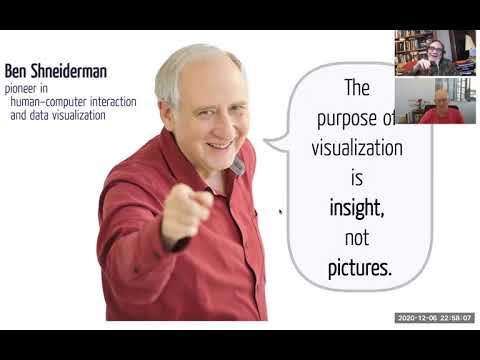
summary
Argues that data visualizations are assistive technology not mere pictures and must offer equivalent non‑visual affordances: concise text summaries and data links, axis labels and derived stats (high, low, range, mean, trend). Demonstrates sonification with the Web Audio API (a 2007–2011 stock-market sonification), tactile output via refreshable pin displays and an open source Spark Braille library (prototype maps lines to braille pins), and vibro feedback via the W3C Vibration API; recommends exposing structured numeric data for low‑effort screen‑reader access.
AI-written summary · about
chapters (5)
- 0:00Start
- 3:02Data visualization is assistive technd
- 42:40Topology Matte
- 48:10Refreshable pin
- 55:50Accessibility
related talks
 49mGetting to the Core of Data Visualization Accessibility
 21mMusical Charts: Using OSS to Make Data Visualizations Accessible to Visually Impaired Users
 38mAccessibility in Data Visualizations: Two Case Studies
 50mAddressing the Core Issue of Data Visualization Accessibility
 41mAccessible Charts Done Right
 20mRich Representations of Visual Content for Screen Reader Users
 31mBringing the Web Back to the Blind
 40mAccess to Tech, Tech to Live