OpenTelemetry tracing for .NET developers

summary
Explains how OpenTelemetry integrates with .NET/C# by adding NuGet SDK + instrumentation packages and exporters (Jaeger, console), showing a console app that emits 10 traces with eight spans each and a web app that auto-creates HTTP and SQL spans. Demonstrates RabbitMQ propagation by calling the propagator Inject on publish and Extract in the consumer so a queued message extends the same distributed trace, visible in Jaeger, with TraceParent header in RabbitMQ enabling end-to-end correlation.
AI-written summary · about
chapters (17)
- 0:00Introduction to OpenTelemetry
- 1:02Evolution of observability
- 2:22Why adopt OpenTelemetry
- 3:29Signals: logs, traces, metrics
- 6:28Agnostic instrumentation
- 8:25OpenTelemetry components
- 10:28Context propagation and APM
- 12:50Personal experience and benefits
- 16:41Terminology and instrumentation
- 18:21Challenges in messaging systems
- 20:03Getting started with .NET
- 23:46Choosing backends
- 25:44Code demo: manual tracing
- 30:45Code demo: web application
- 36:24Distributed tracing and RabbitMQ
- 44:34Actor model integration
- 47:43Conclusion and takeaways
related talks
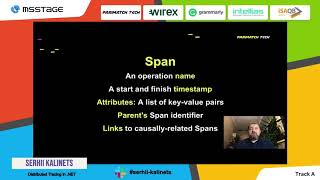 41mDistributed Tracing in .NET
 56mGetting started with OpenTelemetry in .NET
 59mOpenTelemetry will save your day and night
 01h 00mPractical OpenTelemetry for .NET
 01h 01mPractical OpenTelemetry in .NET 8
 01h 04mOpenTelemetry in a Brownfield World
 42mObservable Applications Using OpenTelemetry
 38mPractical introduction to OpenTelemetry tracing