Monitoring MySQL and MongoDB with Prometheus

summary
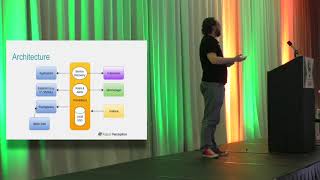
Percona compares monitoring engines and explains why Prometheus was selected to monitor MySQL and MongoDB, describing challenges encountered and how they were resolved. It covers Prometheus configuration and best practices for collecting MySQL and MongoDB metrics to balance data quality, overhead, and storage, and gives practical examples of using Prometheus to troubleshoot common issues.
AI-written summary · about
chapters (13)
- 0:00Start
- 0:20About Percona
- 1:22Many Sides of Monitoring
- 2:15What does MySQL do?
- 2:38Criteria
- 3:00Two Ways to Look
- 3:30Problem Caused By
- 5:00With this in mind we built PMM
- 6:18Meet PMM
- 6:42Inside Percona Monitoring and Management
- 8:59For the User?
- 9:29Our Grand for Plan for PMM
- 11:17Check it out
related talks
 35mBest Practices for MySQL Performance
 10mPrometheus for Monitoring Metrics - Database Monitoring Tools
 21mEasy way of application monitoring
 25mPercona Server for MongoDB: Features Overview
 30mWhy we recommend PMM to our clients
 43mMySQL Like We Don't Know It
 46mPrometheus as a Time Series Database
 58mBetter MySQL With Percona PMM