Managing and monitoring a JVM
summary
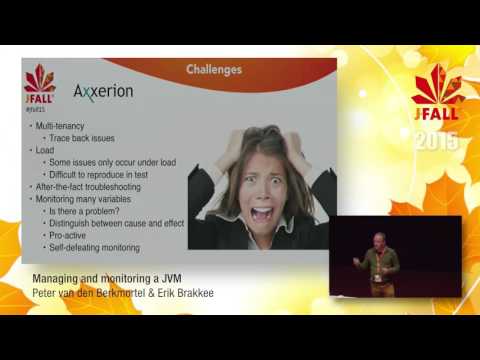
Practical recipes for production JVMs: how CMS fragmentation and the maximum free contiguous space trigger pathological GC pauses, why finalizer leaks and expensive toString calls froze servers, and how a burst of 25 million exceptions revealed the root cause. Shows lightweight on-host techniques — log filtering, ad hoc scripts, CPU/allocation sampling and offline heap analysis — that map memory and CPU hotspots back to individual user actions and which ones are safe to run in production.
AI-written summary · about
chapters (7)
- 0:00Introduction to JVM monitoring
- 7:42Performance challenges in JVM
- 16:14Proactive monitoring tools
- 23:28Memory management essentials
- 33:05Debugging tools and techniques
- 40:01Multi-tenant JVM design
- 44:00Q&A and closing remarks
related talks
 32mMastering JVM Memory Troubleshooting - From OutOfMemoryErrors to Leaks
 02h 41mSolving Memory Leaks in the JVM
 01h 28mThe dark art of performance tuning or how to become a performance hero ...
 49mTrash Talk - Exploring the memory management in the JVM
 43mTrash Talk - Exploring the memory management in the JVM
 56mJava Performance Analysis
 45mMastering JVM Profiling: Advanced Techniques and Real-Life Case Studies
 46mTrash Talk - Exploring the Memory Management in the JVM