The dark art of performance tuning or how to become a performance hero ...

summary
Shows how real Java apps at SaaS scale (4.8 million transactions in 90 minutes) get diagnosed and fixed using concrete tools and numbers: jvisualvm, jinfo, jmap, jstack and gcviewer to spot CPU spikes, GC as a dominating consumer and thread contention; a synchronized map replaced by ConcurrentHashMap cuts a 4.85s benchmark to 0.587s (~10x); heap dumps and Eclipse MAT expose a WeakHashMap key/value cycle causing OOM; demos consistently build a vector into the exact offending line and validate the fix.
AI-written summary · about
chapters (8)
- 0:00Introduction
- 10:21Performance tuning theory
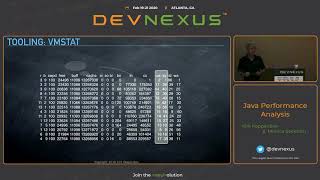
- 23:15JVM and OS tools
- 32:42Live CPU bottleneck demo
- 49:56Garbage collection analysis
- 1:06:31Memory leaks with heap dumps
- 1:20:40Further reading
- 1:27:25Q&A
related talks
 56mThe Dark Arts of Performance Tuning
 56mJava Performance Analysis
 47mJVM Performance Engineering - Inside OpenJDK and the HotSpot Java Virtual Machine
 47mManaging and monitoring a JVM
 43mA Glance At The Java Performance Toolbox
 38mMemory Efficient Java
 01h 32mBuilding and Tuning High Performance Java Platforms
 45mHow difficult can it be to write efficient code?