Operational visibility in distributed systems

summary
Explains how to instrument code end-to-end: emit one request log entry per unit of work, propagate a trace id through every service, and aggregate logs into metrics to drive alarms and dashboards. Recommends structured JSON logs, counters for each error reason, and runtime-adjustable verbosity for deep dives. Shows a Java cache→remote cache→DB example and points to AWS tooling — use CloudWatch Logs, X‑Ray and Athena for collection, tracing and ad hoc queries.
AI-written summary · about
chapters (12)
- 0:00Operational visibility intro
- 1:53Why systems fail
- 2:35Observability vs monitoring
- 5:42Systems evolution challenges
- 8:28Observability origins
- 9:10Three pillars of observability
- 12:37Instrumentation lens
- 16:06Practical instrumentation
- 19:14Structured logging best practices
- 22:44Amazon logging best practices
- 25:52Log analysis tools
- 26:53Observability resources
related talks
 49mImproving Observability of Distributed Systems
 24mObservability with AWS
 31mObservability for Developers: How to Get There
 30mBest practices for application observability at scale
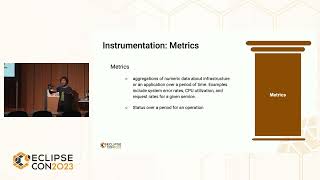 37mThrough the looking glass: Effective observability for cloud native applications
 16mThe State of Observability
 48mObservability or How to Know the State of Your System
 26mDistributed Tracing FAQ