The State of Observability
summary
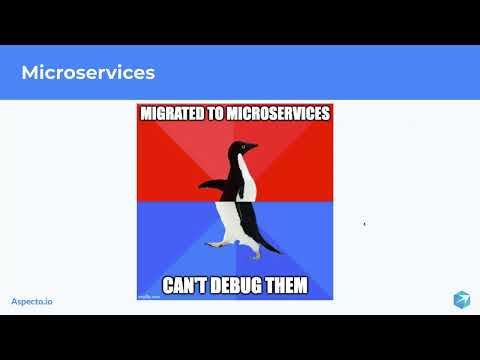
Overview of why microservices need distributed tracing and how observability now rests on logs metrics and traces with traces providing the request-level context that isolates a failing path across services. Practical stack: instrument apps with an OpenTelemetry SDK, export spans to a collector and store them (examples: Elasticsearch + Jaeger/Zipkin or vendors like Aspecto), trace IDs propagate in headers so traces correlate across services, tradeoffs: higher cost and immaturity today but no vendor lock-in.
AI-written summary · about
chapters (8)
- 0:00Introduction
- 1:48What is Observability
- 2:44Observability Pillars
- 4:11Logs
- 5:58Metrics
- 7:41Traces
- 11:58How does it work
- 13:42What do you need
related talks
 49mImproving Observability of Distributed Systems
 33mEffective observability in microservice architectures
 37mObservability, Distributed Tracing & the Complex World
 42mFirst Steps with Observability: OpenTelemetry and You
 48mObservability or How to Know the State of Your System
 37mThrough the looking glass: Effective observability for cloud native applications
 31mUnderstanding Microservices with Distributed Tracing
 34mReduce Complexity with Distributing Tracing