Live Distributed Spying
summary
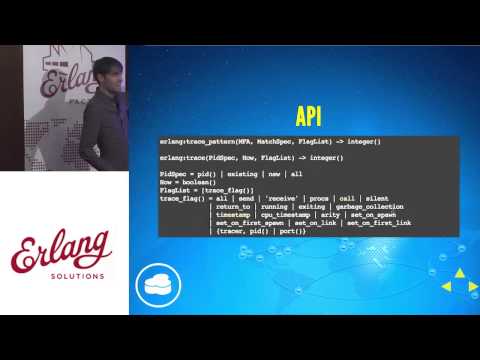
Live Erlang code can be spied on without changing it by using match specs and the built-in trace machinery to attach to new pids, follow spawn/link, and capture call/return/exit/message events; timestamps are available but expensive. Practical tools shown: trace_pattern / match_spec, dbg (built-in), and recon; redbug is mentioned but less recommended. Several prototypes evolve into an experimental tool called spyglass that creates remote shells, loads tracers, and tears them down safely; careless wildcards or global tracing easily crash nodes or fill mailboxes.
AI-written summary · about
chapters (9)
- 0:00Start
- 5:01PROTOTYPE 1
- 7:52CONTEXT: DEVELOPMENT VS. OPERATION
- 18:47How does tracing work? How does anything in Erlang work? Trade-offs.
- 29:09ASYNCHRONOUS Tracee self()
- 32:47BREAKING THINGS
- 41:47STATE MACHINES
- 43:05PROPERTY TESTING
- 44:25SPLIT THINGS UP 1. Code loaders are a little lacking 2. Rely on established libraries like recon 3. Develop cookbook of tracing ideas and tools
related talks
 43mReverse-Engineering a Proprietary Game Server with Erlang
 37mDynamic tracing within a busybox environment
 23mFeature flagging in Erlang using
 46mThe Next Log4jshell?! Preparing for CVEs with eBPF!
 18mSecuring Erlang and Elixir applications
 32mListen to your Engine
 43meBPF Superpowers for SRE
 51mAnalysis of Real World Apps with Frida