Scaling Performance and Availability Monitoring across distributed squads

summary
Skyscanner standardizes a tiny Kotlin data class and an operational event logger to send self‑contained error events (feature, component, description, stack trace) and measurements like time to first result and page load. A simple Python batch job runs hourly, emits CSV SLI numbers, and visualizes per‑feature SLO adherence (example SLO: 99.5% availability; 10,000 sessions with 150 failures → 98.5%). Severity taxonomy maps to critical/error/warning, thresholds drive alerts, and cross‑platform correlation highlights backend impacts.
AI-written summary · about
chapters (5)
- 0:00Introduction and background
- 4:00Defining app availability
- 12:45Measuring performance metrics
- 24:02Applying SRE principles
- 36:01Future plans and hiring
related talks
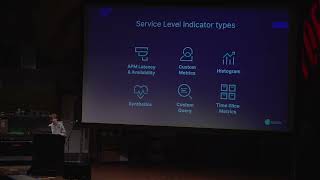 31mServerless Observability: a case study of SLOs
 37mUsing SLOs for Continuous Performance Optimizations of Your K8s Workloads
 25mAn SLO-Driven Approach to Enhance Kubernetes Cluster Reliability
 29mReducing Trauma in Production
 22mLook Ma, No Metrics: A Quest Towards Extracting SLOs
 23mGoing from 30 to 30 Million SLOs
 30mReliable Observability at Scale: Error Budgets for 1,000+
 37mDriving App Reliability with Real Time Monitoring and SLIs