Profiling a Pod in Kubernetes with kube-flame

summary
kube-flame is a kubectl plugin (installed via krew) that automates profiling containers in a Kubernetes pod by copying language-specific profilers (async-profiler for Java, native Go profilers for Go), launching a job that runs a timed sampling session, and returning a FlameGraph SVG. It fetches the appropriate profiler into the pod, profiles for the requested duration across heterogeneous apps, and was tested on a Java application and a Go service (noting CPU profiling required enabling perf_events while allocations and SVG output worked).
AI-written summary · about
chapters (8)
- 0:00kube-flame intro
- 1:06Flame graphs use
- 3:12Java profiling in prod
- 5:44Installing kube-flame
- 7:35Automated profiling
- 9:21CPU vs memory
- 11:48Multi-language apps
- 13:18Demo and conclusion
related talks
 24mWhy Does Continuous Profiling Matter to Developers?
 56mContinuous Profiling the missing piece in your observability puzzle
 36mContinuous Profiling in the Cloud-Native era
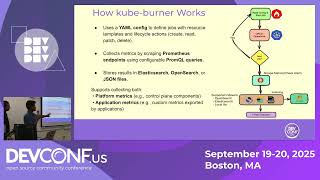 30mK8s Under Fire: Igniting Performance & Burning Through Bottlenecks with Kube-Burner
 26mProfiling Mastery: Decode Your Data and Elevate Observability
 32mDebugging Live Applications the Kubernetes Way: From a Sidecar
 36mProfiling in the cloud-native era - Matthias Loibl
 17mExtending Flamegraphs for Multi-Dimensional Performance Analysis