An Introduction to JVM Performance

summary
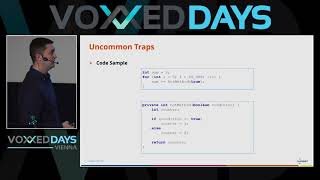
Explains how Oracle’s HotSpot turns bytecode into machine code via HotSpot C2 compiler and tiered JIT (interpreter → C1 → C2), why the JVM profiles at runtime and needs about 10,000 warmup runs before C2 kicks in, and how dispatch kinds—monomorphic, bimorphic, megamorphic—drive inlining and big optimizations. Gives concrete pitfalls: double-brace initialization can trigger megamorphism and cost ~90% in one case, recommends use of JMH and warmups, and highlights escape analysis and vtable dispatch details.
AI-written summary · about
chapters (17)
- 0:00Introduction
- 1:00Disclaimer
- 2:23The Java Program Model
- 4:34Hotspot
- 13:55Overview
- 15:38Callside
- 17:16Virtual Method Table
- 19:47Caches
- 20:54Monomorphic
- 23:07Mono and Megamorphic
- 27:11Inlining
- 29:33Double braced initialization
- 32:12Micro optimization
- 33:42Loop unrolling
- 36:35Hidden classes
- 42:38Escape Analysis
- 44:44Dead Code Elimination
related talks
 41mAn Introduction to JVM Performance
 59mAn Introduction to JVM Performance
 01h 01mAn Introduction to JVM Performance
 01h 09mFrom Bytecode to Native Code in HotSpot JVM
 11mJVM internals — bytecode, JIT, GC, speculative optimization
 43mThe Virtual Machine Under the Hood
 54mJava performance techniques The cost of HotSpot runtime optimizations
 46mJIT Compiler From the Ground Up