Grafana Loki Log Aggregation for Incident Investigations

summary
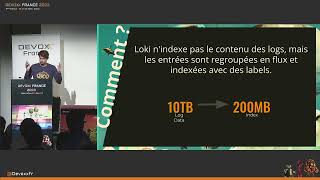
Loki is a log store that ties logs to Prometheus-style service discovery so logs and metrics share labels, letting investigations follow the exact instance that showed a spike in 99th percentile tail latency. It trades full-text inverted indexes for only index metadata, which claims much lower cost. It ingests pod stdout over gRPC streams, runs as Cortex-based multi-tenant microservices, and surfaces errors like 500s, lock timeouts and connection limits alongside dashboards.
AI-written summary · about
related talks
 25mLoki: Prometheus-inspired logging for cloud native
 31mLoki: Like Prometheus But for Logs
 37mGrafana Loki: Like Prometheus, But for logs.
 53mGetting started with Grafana Loki, a modern logs database
 44mIntroduction to Grafana Loki
 15mOperations report: Running Loki on Different On-Prem Environments
 27mObservability with Prometheus and beyond
 29m5 Years in, Loki Turns 3.0