Mirror, Mirror on the Wall, What is the Vainest Metric of Them All?

summary
Argues that common headline metrics mislead and gives concrete alternatives and fixes: 100,000 page views means nothing unless conversion to downloads is measured; counting deploys per day is meaningless without release cycle time and feature value; moving builds from 15 minutes to 45 seconds using a hermetic build tool pleeze and instrumenting TeamCity cuts wasted time; measuring OpenTable-style lead and cycle times reveals 19.5 days of waiting and lets teams cut idle steps to reach 14 minute deploys to production; track Kubernetes API uptake (~30 minutes) and crash rates instead.
AI-written summary · about
chapters (20)
- 0:00Introduction and talk overview
- 1:17What are vanity metrics
- 3:09Conversion funnels and user journeys
- 5:14Three questions to identify vain metrics
- 8:48Real-life examples of vain metrics
- 12:41Number of GitHub commits and stars
- 15:12Build time and developer feedback
- 17:38Cost of infrastructure and automation
- 21:13Meetings as a vanity metric
- 21:58Code coverage and testing philosophy
- 25:28Cost of travel and employee well-being
- 29:30Developer productivity and tools
- 34:07Useful metrics and actionable insights
- 34:28Work in progress and cycle time
- 35:10Lead time vs cycle time explained
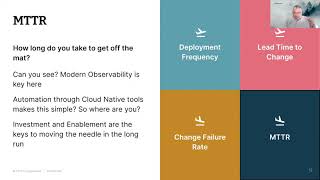
- 36:57Mean time to resolution and failures
- 40:37Application crash rates and issue tracking
- 43:50Release cycle time and conversion metrics
- 46:45Measuring only what matters
- 47:48Summary and key takeaways
related talks
 06mDelivery Metrics: the good, the bad, and the totally ridiculous
 23mMeasure for change
 31mMetrics Mania. Obsession with Measurement can Harm our Teams
 14mI don't think these metrics mean what you think they mean!
 41mRethinking Measurement for High-Performing Teams
 47mCan We Measure Developer Productivity?
 20mHow to Communicate Metrics to Build Engagement
 18mFrom developer productivity to engineering impact